---
title: "Intravascular (IV) Examples"
---
```{r setup, include=FALSE}
library(PKNCA)
library(dplyr)
library(ggplot2)
conflicted::conflicts_prefer(dplyr::filter, dplyr::select, .quiet = TRUE)
```
## The IV dataset: Indomethacin
We use `datasets::Indometh` — IV bolus indomethacin in 6 subjects, sampled over 8 hours.
```{r}
head(Indometh)
str(Indometh)
```
Columns: `Subject` (factor, 6 levels), `time` (h), `conc` (mcg/mL).
We add dose information. The standard IV bolus dose for this study was 25 mg.
```{r}
d_conc <- as.data.frame(Indometh)

d_dose <- data.frame(
  Subject = unique(d_conc$Subject),
  dose    = 25,   # mg
  time    = 0
)

# Quick look at concentration profiles
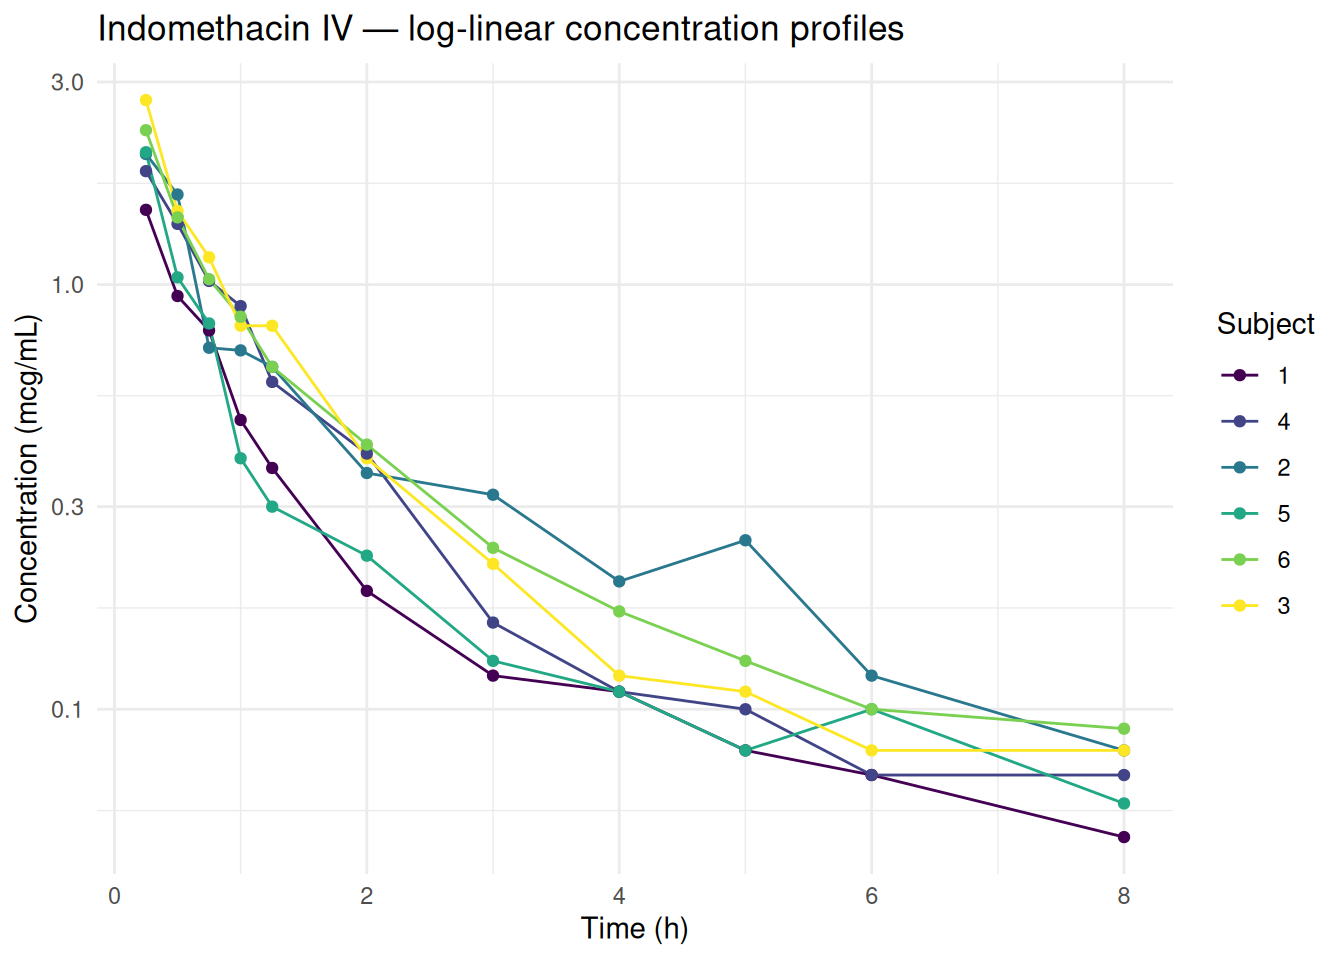
ggplot(d_conc, aes(x = time, y = conc, group = Subject, colour = Subject)) +
  geom_line() + geom_point() +
  scale_y_log10() +
  labs(title = "Indomethacin IV — log-linear concentration profiles",
       x = "Time (h)", y = "Concentration (mcg/mL)") +
  theme_minimal()
```
The log-scale profiles show a biexponential decline — a rapid distribution phase followed by a log-linear terminal phase — typical of IV bolus data; NCA's λz applies to the terminal portion.
---
## Basic IV analysis
```{r}
o_conc <- PKNCAconc(d_conc, conc ~ time | Subject)

o_dose <- PKNCAdose(d_dose, dose ~ time | Subject, route = "intravascular")

# Indometh: no sample at t = 0 (first sample is at 0.25 h).
# Use impute = "start_conc0" to add conc = 0 at t = 0 so the interval can start at 0.
# This slightly underestimates AUClast vs. true C0 back-extrapolation (see C0 section below).
# Request the core IV parameters
iv_intervals <- data.frame(
  start       = 0,
  end         = Inf,
  auclast     = TRUE,
  aucinf.obs  = TRUE,
  half.life   = TRUE,
  cmax        = TRUE,
  tmax        = TRUE,
  lambda.z    = TRUE,
  cl.obs      = TRUE,
  vz.obs      = TRUE,
  mrt.iv.last = TRUE,
  mrt.iv.obs  = TRUE
)

o_data <- PKNCAdata(o_conc, o_dose, intervals = iv_intervals, impute = "start_conc0")
o_nca  <- pk.nca(o_data)

as.data.frame(o_nca) |>
  select(Subject, PPTESTCD, PPORRES) |>
  arrange(Subject, PPTESTCD)
```
Imputation methods, including `start_conc0`, are described in the [Data Imputation vignette](https://humanpred.github.io/pknca/articles/v08-data-imputation.html).
---
## Parameter reference
### Concentration and time landmarks
For IV bolus, Cmax is the first measured concentration (no absorption phase). Tmax is the time of that first sample.
| Parameter | Meaning |
|---|---|
| `cmax` | Maximum observed concentration |
| `tmax` | Time of Cmax |
| `cmin` | Minimum observed concentration in the interval |
| `tmin` | Time of the minimum observed concentration (≥ 0.12.2) |
| `tfirst` | First time with a non-zero (non-BLQ) concentration |
| `tlast` | Last time with a measurable concentration |
| `clast.obs` | Observed concentration at `tlast` |
| `clast.pred` | Predicted concentration at `tlast` (from λz fit) |
| `count_conc` | Total observations (including BLQ) |
| `count_conc_measured` | Observations above LOQ (non-BLQ) |
| `lambda.z.time.last` | Last timepoint used in the λz regression |
```{r}
landmark_params <- data.frame(
  start               = 0,
  end                 = Inf,
  cmax                = TRUE,
  tmax                = TRUE,
  cmin                = TRUE,
  tmin                = TRUE,
  tfirst              = TRUE,
  tlast               = TRUE,
  clast.obs           = TRUE,
  clast.pred          = TRUE,
  count_conc          = TRUE,
  count_conc_measured = TRUE
)

o_nca_lm <- pk.nca(PKNCAdata(o_conc, o_dose, intervals = landmark_params, impute = "start_conc0"))

as.data.frame(o_nca_lm) |>
  filter(PPTESTCD %in% c("cmax","tmax","cmin","tmin","tfirst","tlast",
                          "clast.obs","clast.pred","count_conc","count_conc_measured")) |>
  select(Subject, PPTESTCD, PPORRES) |>
  arrange(Subject, PPTESTCD)
```
### C0 — extrapolated initial concentration
For IV bolus, the true concentration at time 0 is not directly measured (the first sample is taken minutes later). When `c0` is requested, PKNCA tries a chain of methods and uses the first that succeeds: a measured, nonzero concentration at the dose time (`c0`); otherwise back-extrapolation of the semilog line through the first two measured post-dose concentrations (`logslope`); otherwise the first post-dose concentration (`c1`), then the minimum concentration (`cmin`), then zero (`set0`). Here the value at t = 0 is an imputed 0 rather than a measured concentration, so `logslope` supplies C0.
```{r}
iv_with_c0 <- data.frame(
  start    = 0,
  end      = Inf,
  c0       = TRUE,
  cmax     = TRUE,
  auclast  = TRUE,
  aucinf.obs = TRUE
)

o_data_c0 <- PKNCAdata(o_conc, o_dose, intervals = iv_with_c0, impute = "start_conc0")
o_nca_c0  <- pk.nca(o_data_c0)

as.data.frame(o_nca_c0) |>
  filter(PPTESTCD %in% c("c0", "cmax", "auclast", "aucinf.obs")) |>
  select(Subject, PPTESTCD, PPORRES) |>
  arrange(Subject, PPTESTCD)
```
> **Note:** C0 > Cmax is expected for IV bolus — Cmax is the first measured point, C0 is extrapolated back to time 0.
### AUC variants
| Parameter | Meaning |
|---|---|
| `auclast` | AUC from 0 to last measurable concentration (trapezoidal) |
| `aucinf.obs` | AUC extrapolated to ∞, using observed Clast |
| `aucinf.pred` | AUC extrapolated to ∞, using predicted Clast from λz fit |
| `aucpext.obs` | % of AUCinf that is extrapolated (quality check) |
All of these are computed with the current integration method (default **lin up/log down**) — see the [AUC chapter](auc-methods.qmd) for the available methods and how to choose one. AUC families are covered in [AUC Calculation with PKNCA](https://humanpred.github.io/pknca/articles/v05-auc-calculation-with-PKNCA.html).
```{r}
auc_params <- data.frame(
  start       = 0,
  end         = Inf,
  auclast     = TRUE,
  aucinf.obs  = TRUE,
  aucinf.pred = TRUE,
  aucpext.obs = TRUE
)

o_data_auc <- PKNCAdata(o_conc, o_dose, intervals = auc_params, impute = "start_conc0")
o_nca_auc  <- pk.nca(o_data_auc)

as.data.frame(o_nca_auc) |>
  filter(PPTESTCD %in% c("auclast", "aucinf.obs", "aucinf.pred", "aucpext.obs")) |>
  select(Subject, PPTESTCD, PPORRES) |>
  arrange(Subject, PPTESTCD)
```
> **Quality check:** `aucpext.obs` > 20% (the default `max.aucinf.pext` threshold) means too much of the AUC is extrapolated — the study may not have sampled long enough.
### Half-life and λz
λz (lambda.z) is the terminal elimination rate constant estimated from log-linear regression of the terminal phase. Half-life = ln(2) / λz.
```{r}
hl_params <- data.frame(
  start        = 0,
  end          = Inf,
  lambda.z     = TRUE,
  half.life    = TRUE,
  r.squared    = TRUE,
  lambda.z.n.points = TRUE
)

o_data_hl <- PKNCAdata(o_conc, o_dose, intervals = hl_params, impute = "start_conc0")
o_nca_hl  <- pk.nca(o_data_hl)

as.data.frame(o_nca_hl) |>
  filter(PPTESTCD %in% c("lambda.z", "half.life", "r.squared", "lambda.z.n.points")) |>
  select(Subject, PPTESTCD, PPORRES) |>
  arrange(Subject, PPTESTCD)
```
**Controlling half-life quality:**
```{r}
# Stricter: require at least 4 points and R² ≥ 0.95
o_data_strict <- PKNCAdata(
  o_conc, o_dose,
  intervals = hl_params,
  impute = "start_conc0",
  options = list(
    min.hl.points    = 4,
    min.hl.r.squared = 0.95
  )
)
o_nca_strict <- pk.nca(o_data_strict)

as.data.frame(o_nca_strict) |>
  filter(PPTESTCD %in% c("half.life", "r.squared", "lambda.z.n.points")) |>
  select(Subject, PPTESTCD, PPORRES) |>
  arrange(Subject, PPTESTCD)
```
The λz point-selection algorithm and its quality criteria are detailed in the [Half-life chapter](halflife.qmd) and the [Half-Life Calculation vignette](https://humanpred.github.io/pknca/articles/v06-half-life-calculation.html).
**Excluding specific points from λz:**
Use the `exclude_half.life` argument of `PKNCAconc()` to name a logical column (here `excl_hl`) marking points that should not be included in the terminal regression. Below, subject 1's 8 h sample is dropped from the λz fit, and the regression is re-selected without it:
```{r}
d_conc_excl <- d_conc |>
  mutate(excl_hl = ifelse(Subject == "1" & time == 8, TRUE, NA))

o_conc_excl <- PKNCAconc(
  d_conc_excl,
  conc ~ time | Subject,
  exclude_half.life = "excl_hl"
)

o_nca_excl_hl <- pk.nca(PKNCAdata(o_conc_excl, o_dose, intervals = hl_params,
                                  impute = "start_conc0"))

# Subject 1's terminal fit changes when the 8 h point is excluded
bind_rows(
  as.data.frame(o_nca_hl) |> mutate(version = "all points"),
  as.data.frame(o_nca_excl_hl) |> mutate(version = "8 h point excluded")
) |>
  filter(Subject == "1", PPTESTCD %in% c("lambda.z.n.points", "half.life")) |>
  select(version, PPTESTCD, PPORRES)
```
### Clearance and volume
For IV dosing, clearance and volume are obtained directly (no bioavailability factor involved), unlike the apparent CL/F and Vz/F of extravascular routes.
| Parameter | Formula | Meaning |
|---|---|---|
| `cl.obs` | Dose / AUCinf.obs | Total body clearance (L/h) |
| `cl.pred` | Dose / AUCinf.pred | CL using predicted Clast |
| `cl.last` | Dose / AUClast | CL using AUClast only (no extrapolation) |
| `cl.all` | Dose / AUCall | CL using AUCall (BLQs as zero) |
| `vz.obs` | CL.obs / λz | Volume of distribution — terminal phase |
| `vz.pred` | CL.pred / λz | Vz using predicted Clast |
| `vss.obs` | CL.obs × MRT | Volume at steady state (observed) |
| `vss.pred` | CL.pred × MRT | Volume at steady state (predicted) |
| `vss.iv.obs` | CL.obs × MRT.iv | Vss corrected for IV bolus input |
```{r}
cl_params <- data.frame(
  start      = 0,
  end        = Inf,
  cl.obs     = TRUE,
  cl.pred    = TRUE,
  cl.last    = TRUE,
  vz.obs     = TRUE,
  vz.pred    = TRUE,
  vss.obs    = TRUE,
  vss.iv.obs = TRUE
)

o_data_cl <- PKNCAdata(o_conc, o_dose, intervals = cl_params, impute = "start_conc0")
o_nca_cl  <- pk.nca(o_data_cl)

as.data.frame(o_nca_cl) |>
  filter(PPTESTCD %in% c("cl.obs", "cl.pred", "cl.last", "vz.obs", "vss.obs", "vss.iv.obs")) |>
  select(Subject, PPTESTCD, PPORRES) |>
  arrange(Subject, PPTESTCD)
```
### Mean residence time (MRT)
MRT quantifies the average time a drug molecule spends in the body.
For IV, the AUMC (area under the first moment curve) method gives MRT = AUMC / AUC.
All MRT variants for IV:
| Parameter | Meaning |
|---|---|
| `mrt.iv.last` | MRT using AUMClast and AUClast (IV correction) |
| `mrt.iv.obs` | MRT extrapolated to ∞, observed Clast (IV correction) |
| `mrt.iv.pred` | MRT extrapolated to ∞, predicted Clast (IV correction) |
| `mrt.last` | MRT using AUMClast (no IV correction) |
| `mrt.obs` | MRT extrapolated to ∞, observed Clast (no IV correction) |
| `mrt.pred` | MRT extrapolated to ∞, predicted Clast (no IV correction) |
The IV-corrected variants (`mrt.iv.*`) subtract half the infusion duration from the raw AUMC/AUC ratio, while the non-IV variants (`mrt.*`) use the raw ratio — see [MRT correction for infusions](#mrt-correction-for-infusions) below for the formula and a worked example.
```{r}
mrt_params <- data.frame(
  start       = 0,
  end         = Inf,
  mrt.iv.last = TRUE,
  mrt.iv.obs  = TRUE,
  mrt.iv.pred = TRUE,
  mrt.last    = TRUE,
  mrt.obs     = TRUE,
  mrt.pred    = TRUE
)

o_data_mrt <- PKNCAdata(o_conc, o_dose, intervals = mrt_params, impute = "start_conc0")
o_nca_mrt  <- pk.nca(o_data_mrt)

as.data.frame(o_nca_mrt) |>
  filter(grepl("^mrt", PPTESTCD)) |>
  select(Subject, PPTESTCD, PPORRES) |>
  arrange(Subject, PPTESTCD)
```
### Effective half-life and elimination rate constant
**Effective half-life** (`thalf.eff`) is derived from MRT rather than from the terminal regression: `thalf.eff = ln(2) × MRT`. It reflects the half-life that would produce the same accumulation as the observed MRT, useful for multiple-dose design.
**kel** in PKNCA is computed as `1 / MRT`, **not** as λz (the terminal slope from the half-life regression). `kel` and `lambda.z` answer different questions: `lambda.z` is the terminal log-linear slope; `kel` is the MRT-derived rate constant used for multiple-dose accumulation calculations.
All variants:
| Parameter | Formula | Based on |
|---|---|---|
| `thalf.eff.iv.last` | ln(2) × MRT | `mrt.iv.last` |
| `thalf.eff.iv.obs` | ln(2) × MRT | `mrt.iv.obs` |
| `thalf.eff.iv.pred` | ln(2) × MRT | `mrt.iv.pred` |
| `thalf.eff.pred` | ln(2) × MRT | `mrt.pred` |
| `thalf.eff.last` | ln(2) × MRT | `mrt.last` |
| `thalf.eff.obs` | ln(2) × MRT | `mrt.obs` |
| `kel.obs` | 1 / MRT | `mrt.obs` |
| `kel.pred` | 1 / MRT | `mrt.pred` |
| `kel.last` | 1 / MRT | `mrt.last` |
| `kel.iv.obs` | 1 / MRT | `mrt.iv.obs` |
| `kel.iv.pred` | 1 / MRT | `mrt.iv.pred` |
| `kel.iv.last` | 1 / MRT | `mrt.iv.last` |
```{r}
eff_params <- data.frame(
  start              = 0,
  end                = Inf,
  thalf.eff.iv.last  = TRUE,
  thalf.eff.iv.obs   = TRUE,
  thalf.eff.iv.pred  = TRUE,
  thalf.eff.pred     = TRUE,
  thalf.eff.last     = TRUE,
  thalf.eff.obs      = TRUE,
  kel.obs            = TRUE,
  kel.pred           = TRUE,
  kel.last           = TRUE,
  kel.iv.obs         = TRUE,
  kel.iv.pred        = TRUE,
  kel.iv.last        = TRUE
)

o_nca_eff <- pk.nca(PKNCAdata(o_conc, o_dose, intervals = eff_params, impute = "start_conc0"))

as.data.frame(o_nca_eff) |>
  filter(grepl("^(thalf|kel)", PPTESTCD)) |>
  select(Subject, PPTESTCD, PPORRES) |>
  arrange(Subject, PPTESTCD)
```
### IV-route AUC (`auciv*`)
`auciv*` parameters compute AUC using IV-specific formulas. Unlike the general `auclast`/`aucinf.obs`, these treat the dose as a bolus at time 0 and back-extrapolate C0 before integrating.
Complete `auciv*` family:
| Parameter | Meaning |
|---|---|
| `aucivlast` | AUC(0–last), IV method (C0 back-extrapolated) |
| `aucivall` | AUC(0–last), IV method, BLQ treated as 0 |
| `aucivinf.obs` | AUC(0–∞) IV method, observed Clast |
| `aucivinf.pred` | AUC(0–∞) IV method, predicted Clast |
| `aucivint.last` | AUC over interval [start,end], IV method, AUClast extrapolation |
| `aucivint.all` | AUC over interval [start,end], IV method, AUCall extrapolation |
| `aucivpbextlast` | % of `aucivlast` contributed by back-extrapolation — the C0 segment before the first measured sample |
| `aucivpbextall` | % of `aucivall` contributed by the back-extrapolated C0 segment |
| `aucivpbextinf.obs` | % of `aucivinf.obs` contributed by the back-extrapolated C0 segment |
| `aucivpbextinf.pred` | % of `aucivinf.pred` contributed by the back-extrapolated C0 segment |
| `aucivpbextint.last` | % of `aucivint.last` contributed by the back-extrapolated C0 segment |
| `aucivpbextint.all` | % of `aucivint.all` contributed by the back-extrapolated C0 segment |
```{r}
auciv_params <- data.frame(
  start              = 0,
  end                = Inf,
  aucivlast          = TRUE,
  aucivall           = TRUE,
  aucivinf.obs       = TRUE,
  aucivinf.pred      = TRUE,
  aucivpbextlast     = TRUE,
  aucivpbextall      = TRUE,
  aucivpbextinf.obs  = TRUE,
  aucivpbextinf.pred = TRUE
)

o_nca_auciv <- pk.nca(PKNCAdata(o_conc, o_dose, intervals = auciv_params, impute = "start_conc0"))

as.data.frame(o_nca_auciv) |>
  filter(grepl("^auciv", PPTESTCD)) |>
  select(Subject, PPTESTCD, PPORRES) |>
  arrange(Subject, PPTESTCD)
```
> **When to use `auciv*` vs `auclast`/`aucinf.obs`:** For a true IV bolus where C0 is back-extrapolated, `aucivlast` and `aucivinf.obs` give the more theoretically correct AUC. For practical purposes the numerical difference is usually small.
---
## IV infusion (non-bolus)
For IV infusions, tell PKNCA the infusion duration via a `duration` column in the dose data frame and the `duration` argument to `PKNCAdose()`. PKNCA then:
- Interpolates the concentration **at end of infusion** (`ceoi`) from the surrounding measured timepoints
- Applies the IV correction to MRT: `MRT_infusion = AUMC/AUC − duration/2`
The Indomethacin dataset is IV bolus, but we can re-label the dose as a 30-minute (0.5 h) infusion to illustrate the workflow. The concentration data are unchanged; only the dose metadata differs.
```{r}
# Re-label the bolus dose as a 30-minute infusion
d_dose_inf <- d_dose |>
  mutate(duration = 0.5)  # 0.5 hours = 30 min

o_dose_inf <- PKNCAdose(
  d_dose_inf,
  dose ~ time | Subject,
  route    = "intravascular",
  duration = "duration"   # column name in d_dose_inf
)
```
### Infusion-specific parameter: `ceoi`
`ceoi` is the concentration at the **end of infusion** — for an infusion, `ceoi` plays the role that Cmax plays for extravascular dosing. PKNCA interpolates it from the surrounding observed timepoints using the current AUC method. Interpolation rules are documented in the [dose-aware interpolation vignette](https://humanpred.github.io/pknca/articles/v21-methods-for-dose-aware-interpolation-and-extrapolation.html).
```{r}
inf_intervals <- data.frame(
  start      = 0,
  end        = Inf,
  ceoi       = TRUE,    # concentration at end of infusion (interpolated)
  auclast    = TRUE,
  aucinf.obs = TRUE,
  half.life  = TRUE,
  cl.obs     = TRUE,
  mrt.iv.obs = TRUE     # MRT with infusion duration correction
)

o_data_inf <- PKNCAdata(o_conc, o_dose_inf, intervals = inf_intervals,
                         impute = "start_conc0")
o_nca_inf  <- pk.nca(o_data_inf)

as.data.frame(o_nca_inf) |>
  filter(PPTESTCD %in% c("ceoi", "auclast", "aucinf.obs",
                          "half.life", "cl.obs", "mrt.iv.obs")) |>
  select(Subject, PPTESTCD, PPORRES) |>
  tidyr::pivot_wider(names_from = PPTESTCD, values_from = PPORRES) |>
  arrange(Subject)
```
### MRT correction for infusions
The `mrt.iv.*` parameters subtract `duration/2` from the raw `AUMC/AUC` ratio:
$$\text{MRT}_{IV} = \frac{\text{AUMC}}{\text{AUC}} - \frac{\text{duration}}{2}$$
For an IV bolus (`duration = 0`) the correction is zero. For a 0.5 h infusion, the correction is 0.25 h. Any deviation from theory comes from the trapezoidal AUMC/AUC estimate itself, not from the correction term.
Use `mrt.iv.obs` (extrapolated to ∞) when the terminal phase is well characterized and `mrt.iv.last` (to last measurable) otherwise.
---
## AUC over a specific interval
For steady-state or partial AUC windows:
```{r}
# AUC from 0 to 4 hours
partial_auc <- data.frame(
  start   = 0,
  end     = 4,
  auclast = TRUE,
  cmax    = TRUE
)

o_data_partial <- PKNCAdata(o_conc, o_dose, intervals = partial_auc, impute = "start_conc0")
o_nca_partial  <- pk.nca(o_data_partial)

as.data.frame(o_nca_partial) |>
  select(Subject, PPTESTCD, PPORRES) |>
  arrange(Subject)
```
Interval semantics are explained in [Selection of Calculation Intervals](https://humanpred.github.io/pknca/articles/v03-selection-of-calculation-intervals.html).
---
## Units
Assign units to get automatic unit propagation through derived parameters. See the [Units chapter](units.qmd) and [Unit Assignment and Conversion with PKNCA](https://humanpred.github.io/pknca/articles/v07-unit-conversion.html) for the full units workflow.
```{r}
units_table <- pknca_units_table(
  concu  = "mcg/mL",
  timeu  = "h",
  doseu  = "mg",
  amountu = "mg"
)

o_conc_u <- PKNCAconc(d_conc, conc ~ time | Subject, concu = "mcg/mL", timeu = "h")
o_dose_u <- PKNCAdose(d_dose, dose ~ time | Subject, route = "intravascular",
                      doseu = "mg")
o_data_u <- PKNCAdata(o_conc_u, o_dose_u, intervals = iv_intervals, units = units_table,
                     impute = "start_conc0")
o_nca_u  <- pk.nca(o_data_u)

as.data.frame(o_nca_u) |>
  filter(PPTESTCD %in% c("auclast", "cl.obs", "vz.obs")) |>
  select(Subject, PPTESTCD, PPORRES) |>
  arrange(Subject, PPTESTCD)
```
---
## Excluding observations
Mark individual observations to exclude from calculations (e.g. suspected sampling errors):
```{r}
d_conc_with_excl <- d_conc |>
  mutate(excl = ifelse(Subject == "2" & time == 2, "suspected contamination", NA_character_))

o_conc_excl_gen <- PKNCAconc(d_conc_with_excl, conc ~ time | Subject, exclude = "excl")

# The flagged row stays in the data with its exclusion reason
as.data.frame(o_conc_excl_gen) |> filter(!is.na(excl))
```
The exclusion reason travels with the data (shown above), and the excluded point is dropped from every parameter calculation. This is broader than the `exclude_half.life` example in the half-life section, which removed a point from only the λz regression.
Below-limit-of-quantification (BLQ) values are handled separately from exclusions, via the `conc.blq` option — see the [BLQ section of the Extravascular chapter](extravascular.qmd#blq-below-limit-of-quantification-handling).
---
## Summary with custom statistics
```{r}
# Default summary uses geometric mean ± CV% for most parameters
summary(o_nca)
```
Customize the summary function — for example, report arithmetic mean (SD) for Tmax instead of its default median [range]:
```{r}
PKNCA.set.summary(
  "tmax",
  description = "arithmetic mean (SD)",
  point  = business.mean,
  spread = business.sd
)

summary(o_nca)
```
Summary customization and results exclusion are covered in the [Post-processing chapter](postprocessing.qmd) and the [Post-Processing vignette](https://humanpred.github.io/pknca/articles/v07-post-processing.html).
---
## Full parameter list for IV
All IV-relevant parameters you can request in an interval:
```{r}
interval_cols <- get.interval.cols()
iv_relevant <- c(
  # Concentration / time landmarks
  "c0", "cmax", "cmin", "tmax", "tmin", "tfirst", "tlast",
  "clast.obs", "clast.pred", "count_conc", "count_conc_measured",
  # AUC family
  "auclast", "aucall", "aucinf.obs", "aucinf.pred",
  "aucpext.obs", "aucpext.pred",
  "aucint.last", "aucint.last.dose", "aucint.all", "aucint.all.dose",
  "aucint.inf.obs", "aucint.inf.obs.dose",
  # IV-specific AUC
  "aucivlast", "aucivall", "aucivinf.obs", "aucivinf.pred",
  "aucivint.last", "aucivint.all",
  "aucivpbextlast", "aucivpbextall", "aucivpbextinf.obs", "aucivpbextinf.pred",
  # AUMC
  "aumclast", "aumcall", "aumcinf.obs", "aumcinf.pred",
  # Half-life / λz
  "half.life", "lambda.z", "lambda.z.n.points", "lambda.z.time.first", "lambda.z.time.last",
  "r.squared", "adj.r.squared", "span.ratio",
  # Clearance
  "cl.obs", "cl.pred", "cl.last", "cl.all",
  # Volume
  "vz.obs", "vz.pred", "vss.obs", "vss.pred", "vss.iv.obs", "vss.iv.pred",
  "vss.last", "vss.iv.last",
  # MRT
  "mrt.iv.last", "mrt.iv.obs", "mrt.iv.pred", "mrt.last", "mrt.obs", "mrt.pred",
  # Effective half-life / kel
  "thalf.eff.iv.last", "thalf.eff.iv.obs", "thalf.eff.iv.pred", "thalf.eff.pred",
  "thalf.eff.last", "thalf.eff.obs",
  "kel.obs", "kel.pred", "kel.last", "kel.iv.obs", "kel.iv.pred", "kel.iv.last",
  # Dose-normalized
  "auclast.dn", "aucinf.obs.dn", "cmax.dn", "clast.obs.dn"
)

# All registered in PKNCA
sort(names(interval_cols)[names(interval_cols) %in% iv_relevant])
```
---
::: {.callout-note icon=false appearance="minimal"}
**pkgdown reference:** [PKNCAconc()](https://humanpred.github.io/pknca/reference/PKNCAconc.html) · [PKNCAdose()](https://humanpred.github.io/pknca/reference/PKNCAdose.html) · [PKNCAdata()](https://humanpred.github.io/pknca/reference/PKNCAdata.html) · [pk.nca()](https://humanpred.github.io/pknca/reference/pk.nca.html) · [pknca_units_table()](https://humanpred.github.io/pknca/reference/pknca_units_table.html) · [PKNCA.set.summary()](https://humanpred.github.io/pknca/reference/PKNCA.set.summary.html) · [get.interval.cols()](https://humanpred.github.io/pknca/reference/get.interval.cols.html) · [summary()](https://humanpred.github.io/pknca/reference/summary.PKNCAresults.html) · [business.*()](https://humanpred.github.io/pknca/reference/business.mean.html) · [PKNCA_impute_method_start_*()](https://humanpred.github.io/pknca/reference/PKNCA_impute_method.html)
:::