Styling Tables with tfl_table
v03-tfl_table_styling.Rmd
library(writetfl)
library(dplyr)   # for group_by()
#>
#> Attaching package: 'dplyr'
#> The following objects are masked from 'package:stats':
#>
#>     filter, lag
#> The following objects are masked from 'package:base':
#>
#>     intersect, setdiff, setequal, union
# Clinical data and column spec used throughout this vignette.
# treatment is the first column so it can serve as the group column.
clinical <- data.frame(
  treatment  = c(rep("Active (n=120)", 3),       rep("Placebo (n=118)", 3)),
  subgroup   = c("All patients", "Age < 65",    "Age ≥ 65",
                 "All patients", "Age < 65",    "Age ≥ 65"),
  n          = c(120L,  74L,  46L,  118L,  71L,  47L),
  responders = c( 68L,  44L,  24L,   31L,  18L,  13L),
  rate_pct   = c(56.7, 59.5, 52.2,  26.3, 25.4, 27.7),
  stringsAsFactors = FALSE
)

col_spec <- list(
  tfl_colspec("treatment",  label = "Treatment Arm",  width = unit(1.3, "inches")),
  tfl_colspec("subgroup",   label = "Subgroup",       width = unit(1.4, "inches")),
  tfl_colspec("n",          label = "N",              width = unit(0.4, "inches")),
  tfl_colspec("responders", label = "Resp.",          width = unit(0.5, "inches")),
  tfl_colspec("rate_pct",   label = "Rate (%)",       width = unit(0.65, "inches"))
)
Overview
tfl_table() accepts a gp argument that is a
named list of gpar() objects. Each key
targets a specific visual element of the rendered table. Keys that are
not supplied fall back to sensible clinical defaults; you only need to
specify the elements you want to change.
The full set of recognized keys is:
| Key | Targets | Default |
|---|---|---|
gp$table |
Base font for all table text | gpar(fontsize = 9, fontfamily = "sans") |
gp$header_row |
Column header row text; fill sets background color |
gpar(fontface = "bold") (inherits
gp$table) |
gp$data_row |
Data cell text; fill sets background (vector
alternates) |
inherits gp$table
|
gp$group_col |
Row-header column text | inherits gp$table
|
gp$continued |
Continuation marker text |
gpar(fontface = "italic") (inherits
gp$table) |
gp$col_header_rule |
Rule drawn under column header row | gpar(lwd = 1) |
gp$group_rule |
Rules drawn between groups | gpar(lwd = 0.5, lty = "dotted") |
gp$row_rule |
Rules drawn between data rows | gpar(lwd = 0.5) |
gp$row_header_sep |
Vertical rule after row-header columns | gpar(lwd = 0.5) |
Inheritance is cascading: gp$data_row starts from
gp$table, so setting
gp$table = gpar(fontsize = 8) automatically shrinks data
cells unless you explicitly override gp$data_row.
Page-level typography — the text in the page header, caption,
footnote, and footer zones — is controlled by the gp
argument of export_tfl_page() / export_tfl(),
not by tfl_table()’s gp.
This vignette covers the styling arguments grouped into:
Typography
Base font — gp$table
gp$table is the typographic root for the whole table.
Every other gp key inherits from it unless overridden.
tbl <- tfl_table(
  clinical,
  gp = list(
    table = gpar(fontsize = 8, fontfamily = "serif")
  )
)

export_tfl(tbl, preview = TRUE, header_left = "Base font: serif 8pt")
Changing gp$table propagates to all rows and rules
unless you selectively override a more specific key.
Column header row — gp$header_row and
show_col_names
The column header row renders the column names (or labels supplied
via tfl_colspec()). By default headers are
bold at the base font size.
# Custom header: slightly larger, italic instead of bold
tbl <- tfl_table(
  clinical,
  gp = list(
    table      = gpar(fontsize = 9),
    header_row = gpar(fontface = "italic", fontsize = 10)
  )
)

export_tfl(tbl, preview = TRUE, header_left = "Header row: italic 10pt")
Set show_col_names = FALSE to suppress the header row
entirely — useful when you are stacking multiple tfl_table
objects on one page and only the first needs column labels.
tbl_no_header <- tfl_table(
  clinical,
  show_col_names = FALSE
)

export_tfl(tbl_no_header, preview = TRUE,
           header_left = "show_col_names = FALSE")
Data row — gp$data_row
gp$data_row controls the appearance of every non-header,
non-group-column cell. It inherits gp$table
automatically.
tbl <- tfl_table(
  clinical,
  gp = list(
    table    = gpar(fontsize = 9),
    data_row = gpar(col = "grey30")
  )
)

export_tfl(tbl, preview = TRUE, header_left = "Data row: grey text")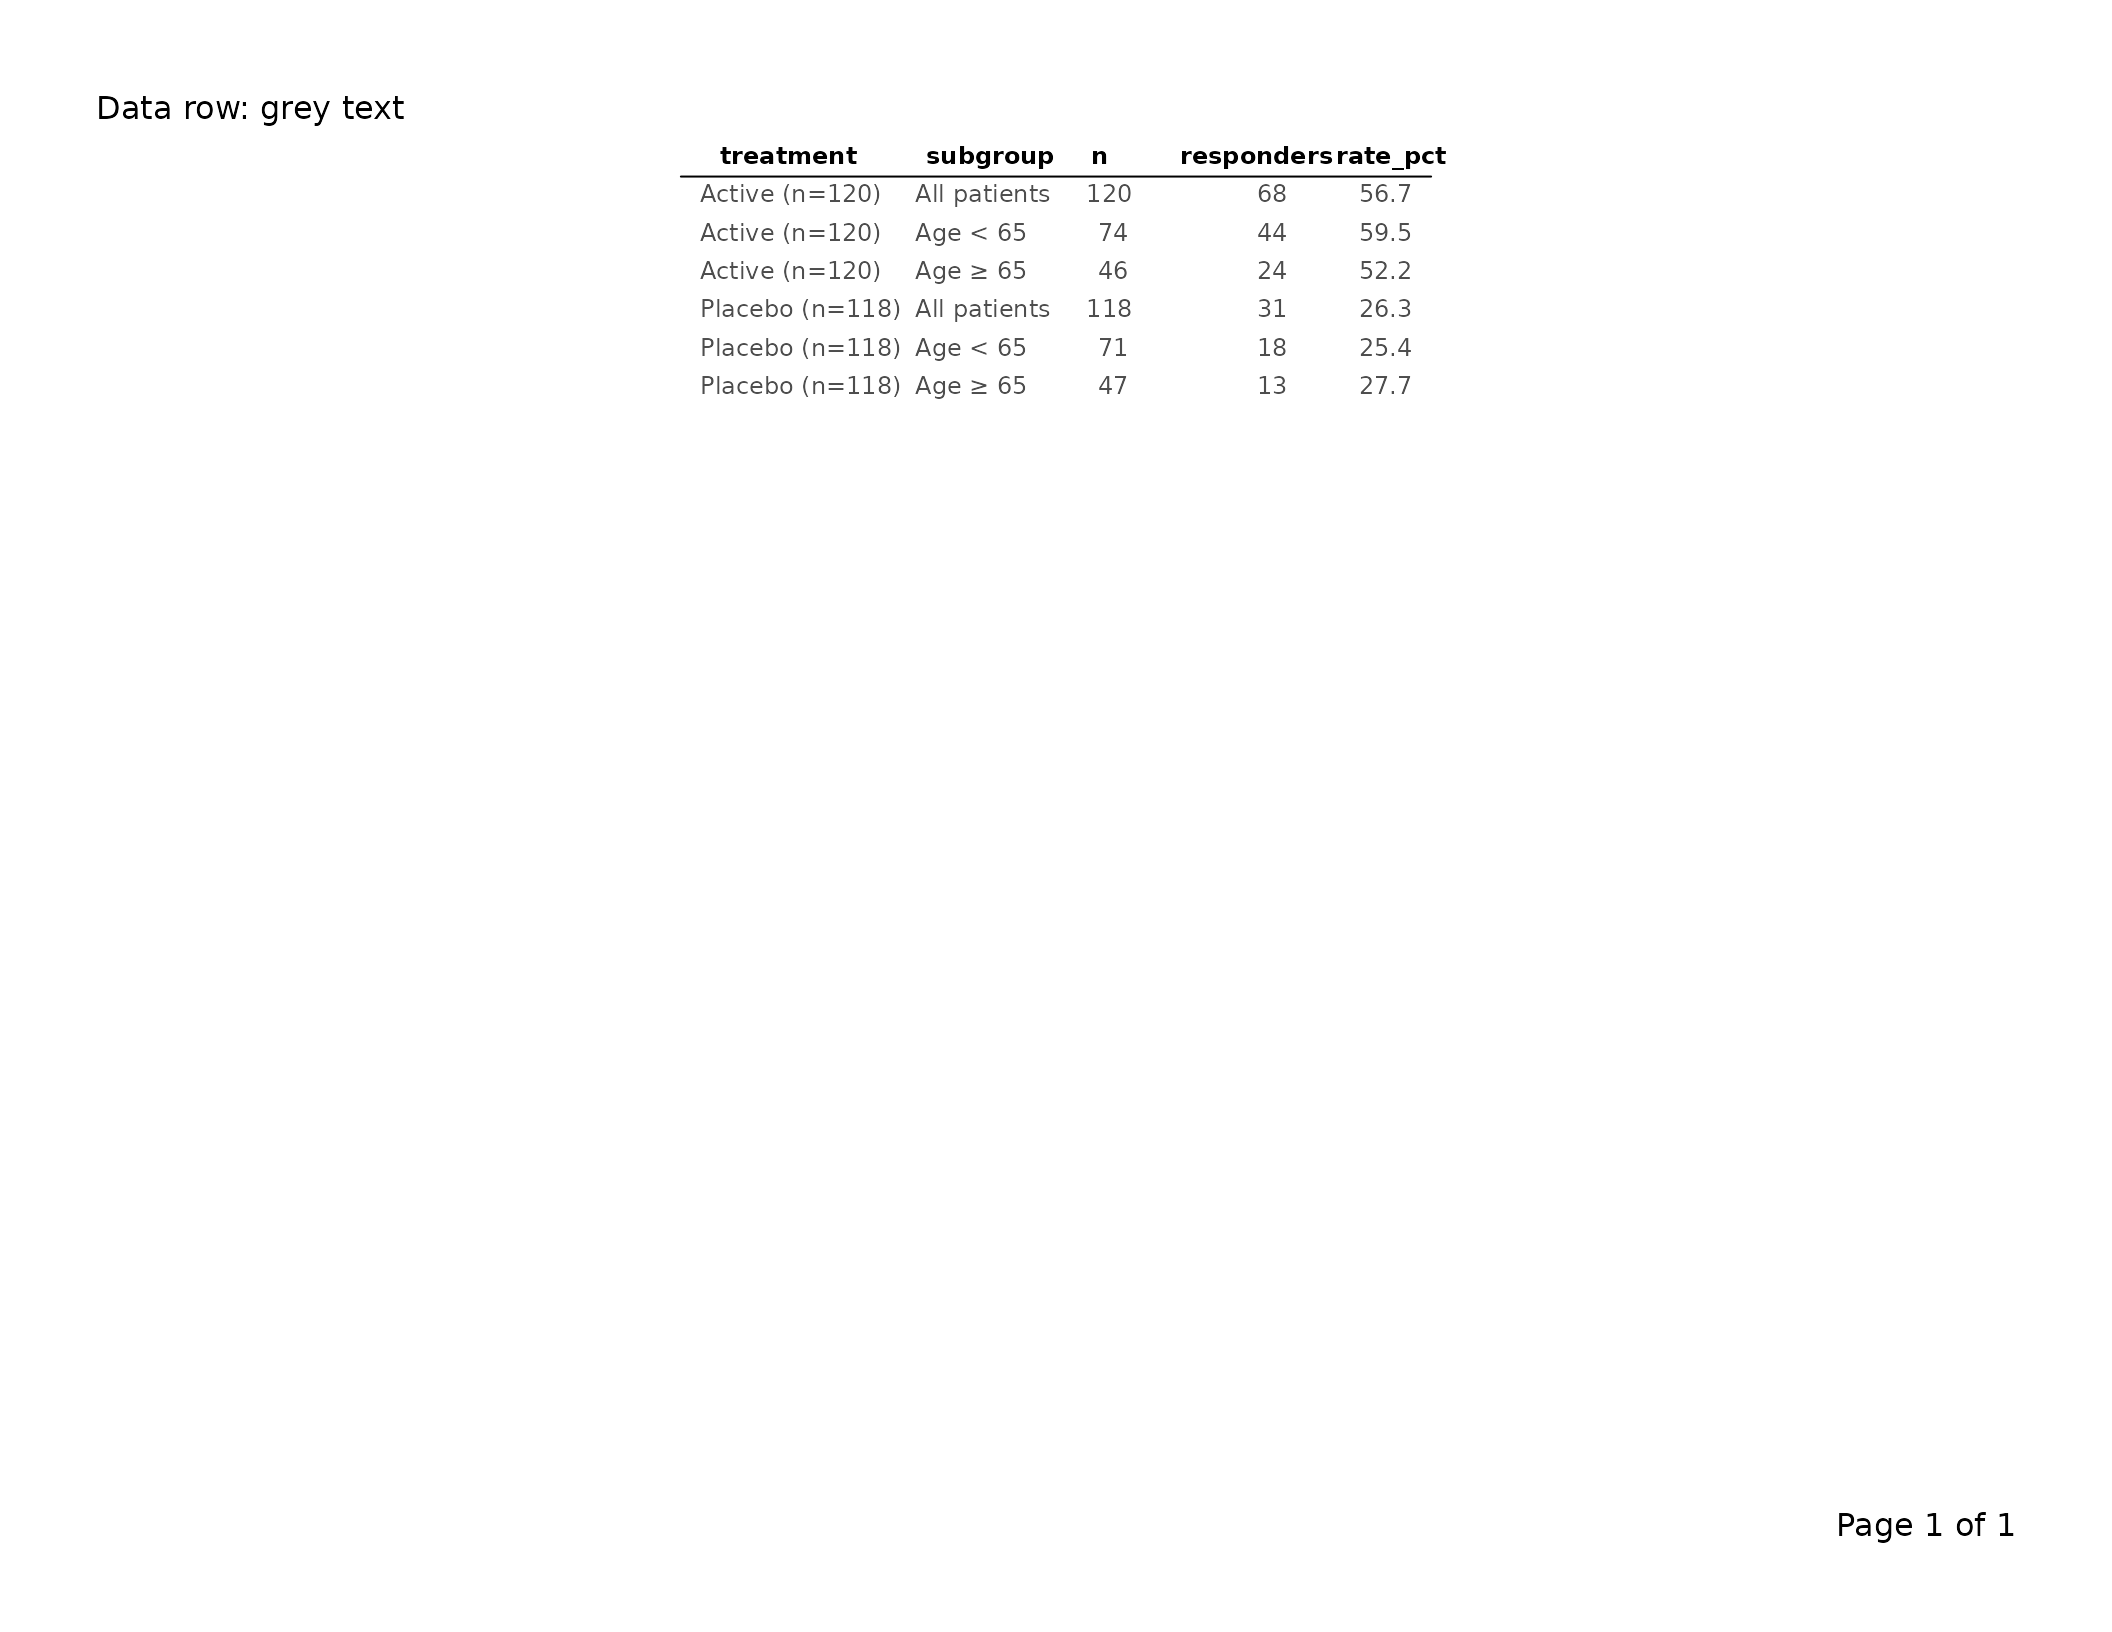
Group column — gp$group_col and per-column
override
Row-header (group) columns — those designated via
dplyr::group_by() — receive their own style key,
gp$group_col, which also inherits
gp$table.
# Bold group column to distinguish it from data columns
tbl <- clinical |>
  group_by(treatment) |>
  tfl_table(
    cols = list(
      tfl_colspec("treatment",  label = "Treatment Arm", width = unit(1.3, "inches")),
      tfl_colspec("subgroup",   label = "Subgroup",      width = unit(1.4, "inches")),
      tfl_colspec("n",          label = "N",             width = unit(0.4, "inches")),
      tfl_colspec("rate_pct",   label = "Rate (%)",      width = unit(0.65, "inches"))
    ),
    gp = list(
      group_col = gpar(fontface = "bold")
    )
  )

export_tfl(tbl, preview = TRUE, header_left = "Group column: bold")
To override a single group column without touching
the others, pass gp directly to
tfl_colspec():
# The treatment group column gets bold via its tfl_colspec gp;
# any other group columns would stay at the gp$group_col default
tbl <- clinical |>
  group_by(treatment) |>
  tfl_table(
    cols = list(
      tfl_colspec("treatment",  label = "Treatment Arm", width = unit(1.3, "inches"),
                  gp = gpar(fontface = "bold")),
      tfl_colspec("subgroup",   label = "Subgroup",      width = unit(1.4, "inches")),
      tfl_colspec("n",          label = "N",             width = unit(0.4, "inches")),
      tfl_colspec("rate_pct",   label = "Rate (%)",      width = unit(0.65, "inches"))
    )
  )

export_tfl(tbl, preview = TRUE,
           header_left = "Per-colspec gp overrides group_col gp")
The gp on tfl_colspec() takes precedence
over gp$group_col for that specific column; all other group
columns still inherit gp$group_col.
Continuation marker — gp$continued and
row_cont_msg
When a table spans multiple pages, tfl_table() injects a
continuation marker at the bottom of each non-final page. By default the
marker text is "(continued)" and is rendered in italic.
# Smaller continuation marker, explicit message
tbl <- tfl_table(
  clinical,
  row_cont_msg = "(table continues on next page)",
  gp = list(
    continued = gpar(fontface = "italic", fontsize = 7, col = "grey50")
  )
)
row_cont_msg replaces the default
"(continued)" string. gp$continued controls
the visual rendering of whatever text row_cont_msg
provides. The continuation marker only appears on tables with more rows
than fit on one page; see vignette("v02-tfl_table_intro")
for an example.
Rules and separators
Three boolean arguments switch horizontal rules on or off; their
corresponding gp keys control line appearance. A vertical
separator between row-headers and data columns is also available.
Column header rule — col_header_rule
A horizontal rule drawn immediately below the column header row.
# Thicker header rule
tbl <- tfl_table(
  clinical,
  col_header_rule = TRUE,
  gp = list(
    col_header_rule = gpar(lwd = 1.5)
  )
)

export_tfl(tbl, preview = TRUE, header_left = "Header rule: lwd = 1.5")
# No header rule at all
tbl_no_rule <- tfl_table(
  clinical,
  col_header_rule = FALSE
)

export_tfl(tbl_no_rule, preview = TRUE,
           header_left = "col_header_rule = FALSE")
Group rules — group_rule,
group_rule_after_last
A rule drawn at the boundary between adjacent groups (defined by
changes in any group column). group_rule_after_last
controls whether a rule also appears after the final group.
The line is drawn as a partial width: it starts at
the column whose value actually changed at this transition and extends
to the right edge of the table. So with nested groups
group_vars = c("Cohort", "Visit"):
| Transition | Outermost change | Rule columns |
|---|---|---|
| Visit changes within the same Cohort | Visit (level 2) | Visit + data columns |
| Cohort changes | Cohort (level 1) | Cohort + Visit + data columns |
This keeps the rule from visually slicing through an outer group’s label that is flowing across multiple rows (see Multi-line group labels and rowspan flow in the intro vignette).
# Solid thin rules between groups, including after the last one
tbl <- clinical |>
  group_by(treatment) |>
  tfl_table(
    cols                  = col_spec,
    group_rule            = TRUE,
    group_rule_after_last = TRUE,
    gp = list(
      group_rule = gpar(lwd = 0.5, lty = "solid")
    )
  )

export_tfl(tbl, preview = TRUE,
           header_left = "Group rules: solid, including after last")
# No between-group rules
tbl_no_grp <- clinical |>
  group_by(treatment) |>
  tfl_table(
    cols       = col_spec,
    group_rule = FALSE
  )

export_tfl(tbl_no_grp, preview = TRUE,
           header_left = "group_rule = FALSE")
The default gp$group_rule is
gpar(lwd = 0.5, lty = "dotted"). Any valid lty
value accepted by grid (e.g. "dashed",
"solid", "dotted") works here.
Row rules — row_rule
A horizontal rule drawn between every pair of consecutive data rows.
Enabled with row_rule = TRUE. Unlike
group_rule (which only fires at group boundaries),
row_rule draws after every row except the last —
unless the row below it is part of a multi-row group
span. A line that would slice through a label flowing downward through
suppressed cells is automatically suppressed, the same way HTML rowspan
cells have no internal borders.
tbl <- tfl_table(
  clinical,
  row_rule = TRUE,
  gp = list(
    row_rule = gpar(lwd = 0.3, col = "grey70")
  )
)

export_tfl(tbl, preview = TRUE,
           header_left = "row_rule = TRUE: lines between rows")
The default gp$row_rule is gpar(lwd = 0.5).
Set row_rule = FALSE (the default) to suppress inter-row
rules entirely.
Vertical row-header separator — row_header_sep
A vertical rule drawn to the right of the last row-header (group)
column, separating the row labels from the data columns. Enabled with
row_header_sep = TRUE.
# Thin solid vertical separator after the group column
tbl <- clinical |>
  group_by(treatment) |>
  tfl_table(
    cols = list(
      tfl_colspec("treatment",  label = "Treatment Arm", width = unit(1.3, "inches")),
      tfl_colspec("subgroup",   label = "Subgroup",      width = unit(1.4, "inches")),
      tfl_colspec("n",          label = "N",             width = unit(0.4, "inches")),
      tfl_colspec("rate_pct",   label = "Rate (%)",      width = unit(0.65, "inches"))
    ),
    row_header_sep = TRUE,
    gp = list(
      row_header_sep = gpar(lwd = 0.75, col = "grey40")
    )
  )

export_tfl(tbl, preview = TRUE,
           header_left = "Row header separator")
# Suppress the separator (default)
tbl_no_sep <- clinical |>
  group_by(treatment) |>
  tfl_table(
    cols           = col_spec,
    row_header_sep = FALSE
  )

export_tfl(tbl_no_sep, preview = TRUE,
           header_left = "row_header_sep = FALSE (default)")
Cell padding
cell_padding is a grid::unit object that
controls the whitespace between cell content and cell boundaries. It
accepts two forms:
Scalar — the same padding is applied on all four sides:
tbl <- tfl_table(
  clinical,
  cell_padding = unit(0.15, "lines")
)

export_tfl(tbl, preview = TRUE, header_left = "Uniform padding: 0.15 lines")
Two-element vector — separate vertical and horizontal padding. Use this when you want tighter horizontal spacing but more vertical breathing room:
tbl <- tfl_table(
  clinical,
  cell_padding = unit(c(0.3, 0.1), "lines")   # [1] = vertical, [2] = horizontal
)

export_tfl(tbl, preview = TRUE,
           header_left = "Asymmetric padding: 0.3v / 0.1h lines")
The first element controls top and bottom padding; the second controls left and right. Reducing horizontal padding allows more columns to fit on a page without reducing font size.
Cell background shading
Background colors for the header row and data rows are controlled
through the fill field in existing gp keys.
Header row background
tbl <- tfl_table(
  clinical,
  gp = list(
    header_row = gpar(fontface = "bold", fill = "lightblue")
  )
)

export_tfl(tbl, preview = TRUE,
           header_left = "Header row with fill = 'lightblue'")
Alternating row colors (zebra striping)
Pass a vector of colors to gp$data_row$fill to alternate
between them:
tbl <- tfl_table(
  clinical,
  gp = list(
    header_row = gpar(fontface = "bold", fill = "steelblue4", col = "white"),
    data_row   = gpar(fill = c("grey95", "white"))
  )
)

export_tfl(tbl, preview = TRUE,
           header_left = "Alternating row colors")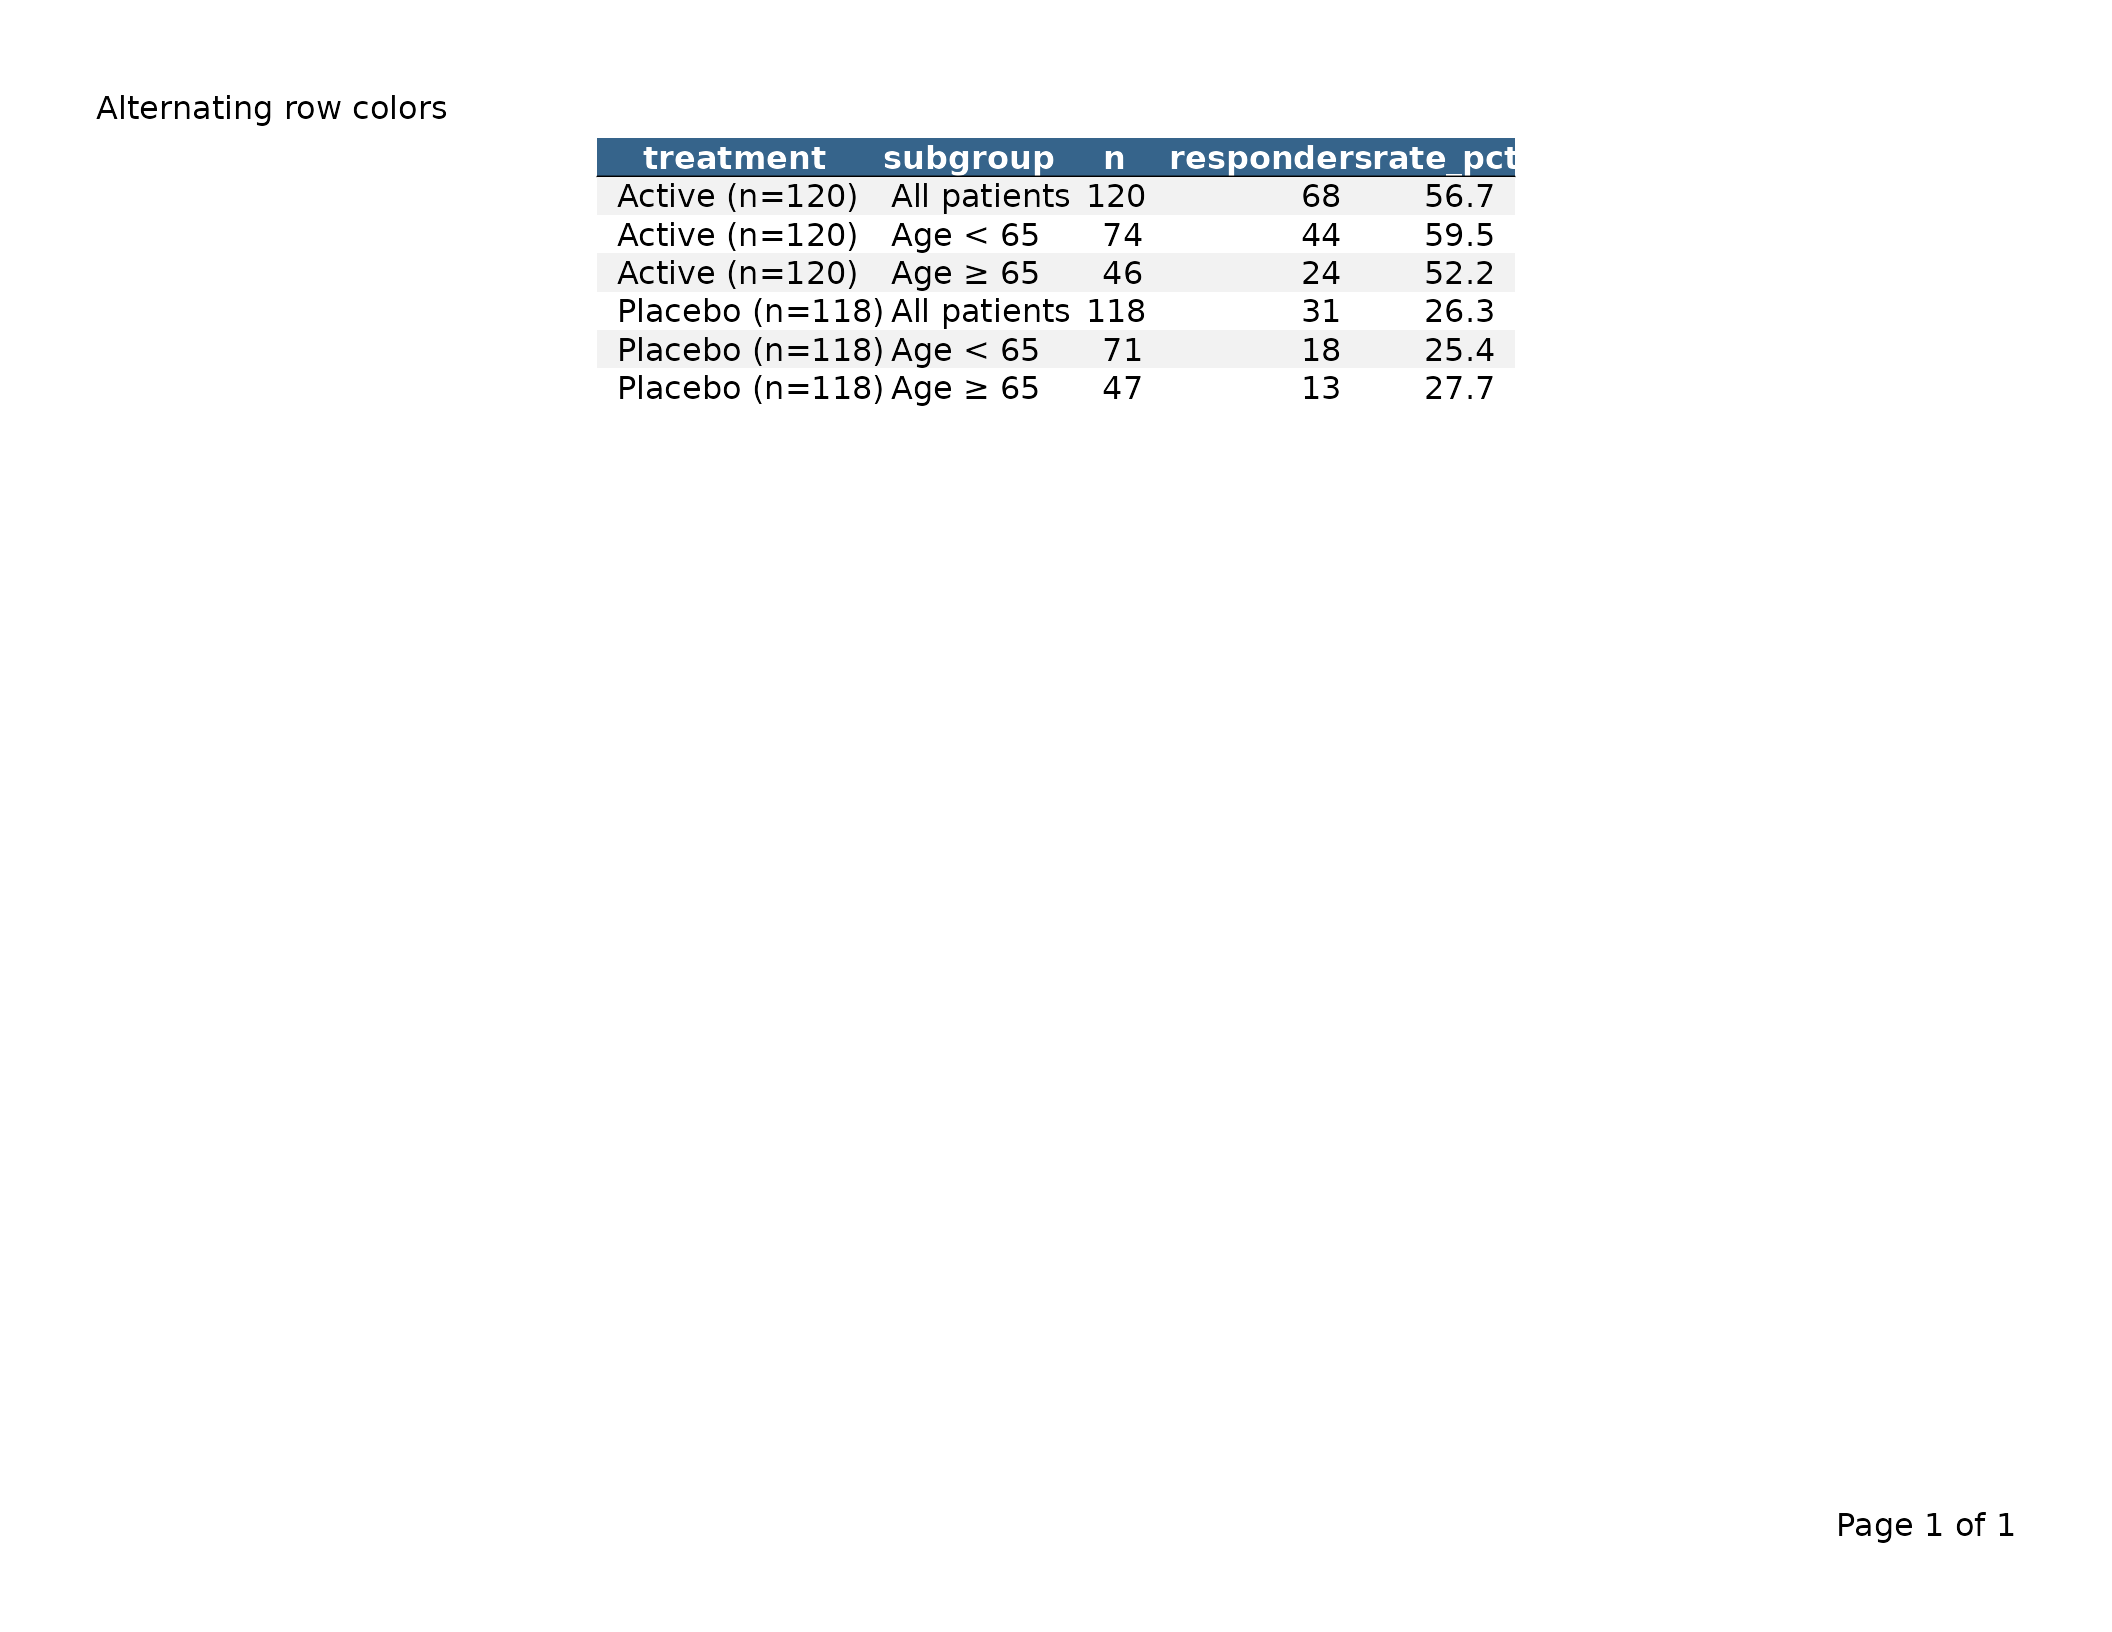
Alternating by group — fill_by = "group"
By default, fill_by = "row" cycles through the color
vector for each data row. Setting fill_by = "group"
advances the color index only at group boundaries, so all rows in the
same group share one background color.
tbl <- clinical |>
  group_by(treatment) |>
  tfl_table(
    cols    = col_spec,
    fill_by = "group",
    gp = list(
      data_row = gpar(fill = c("grey95", "white"))
    )
  )

export_tfl(tbl, preview = TRUE,
           header_left = "fill_by = 'group': banded groups")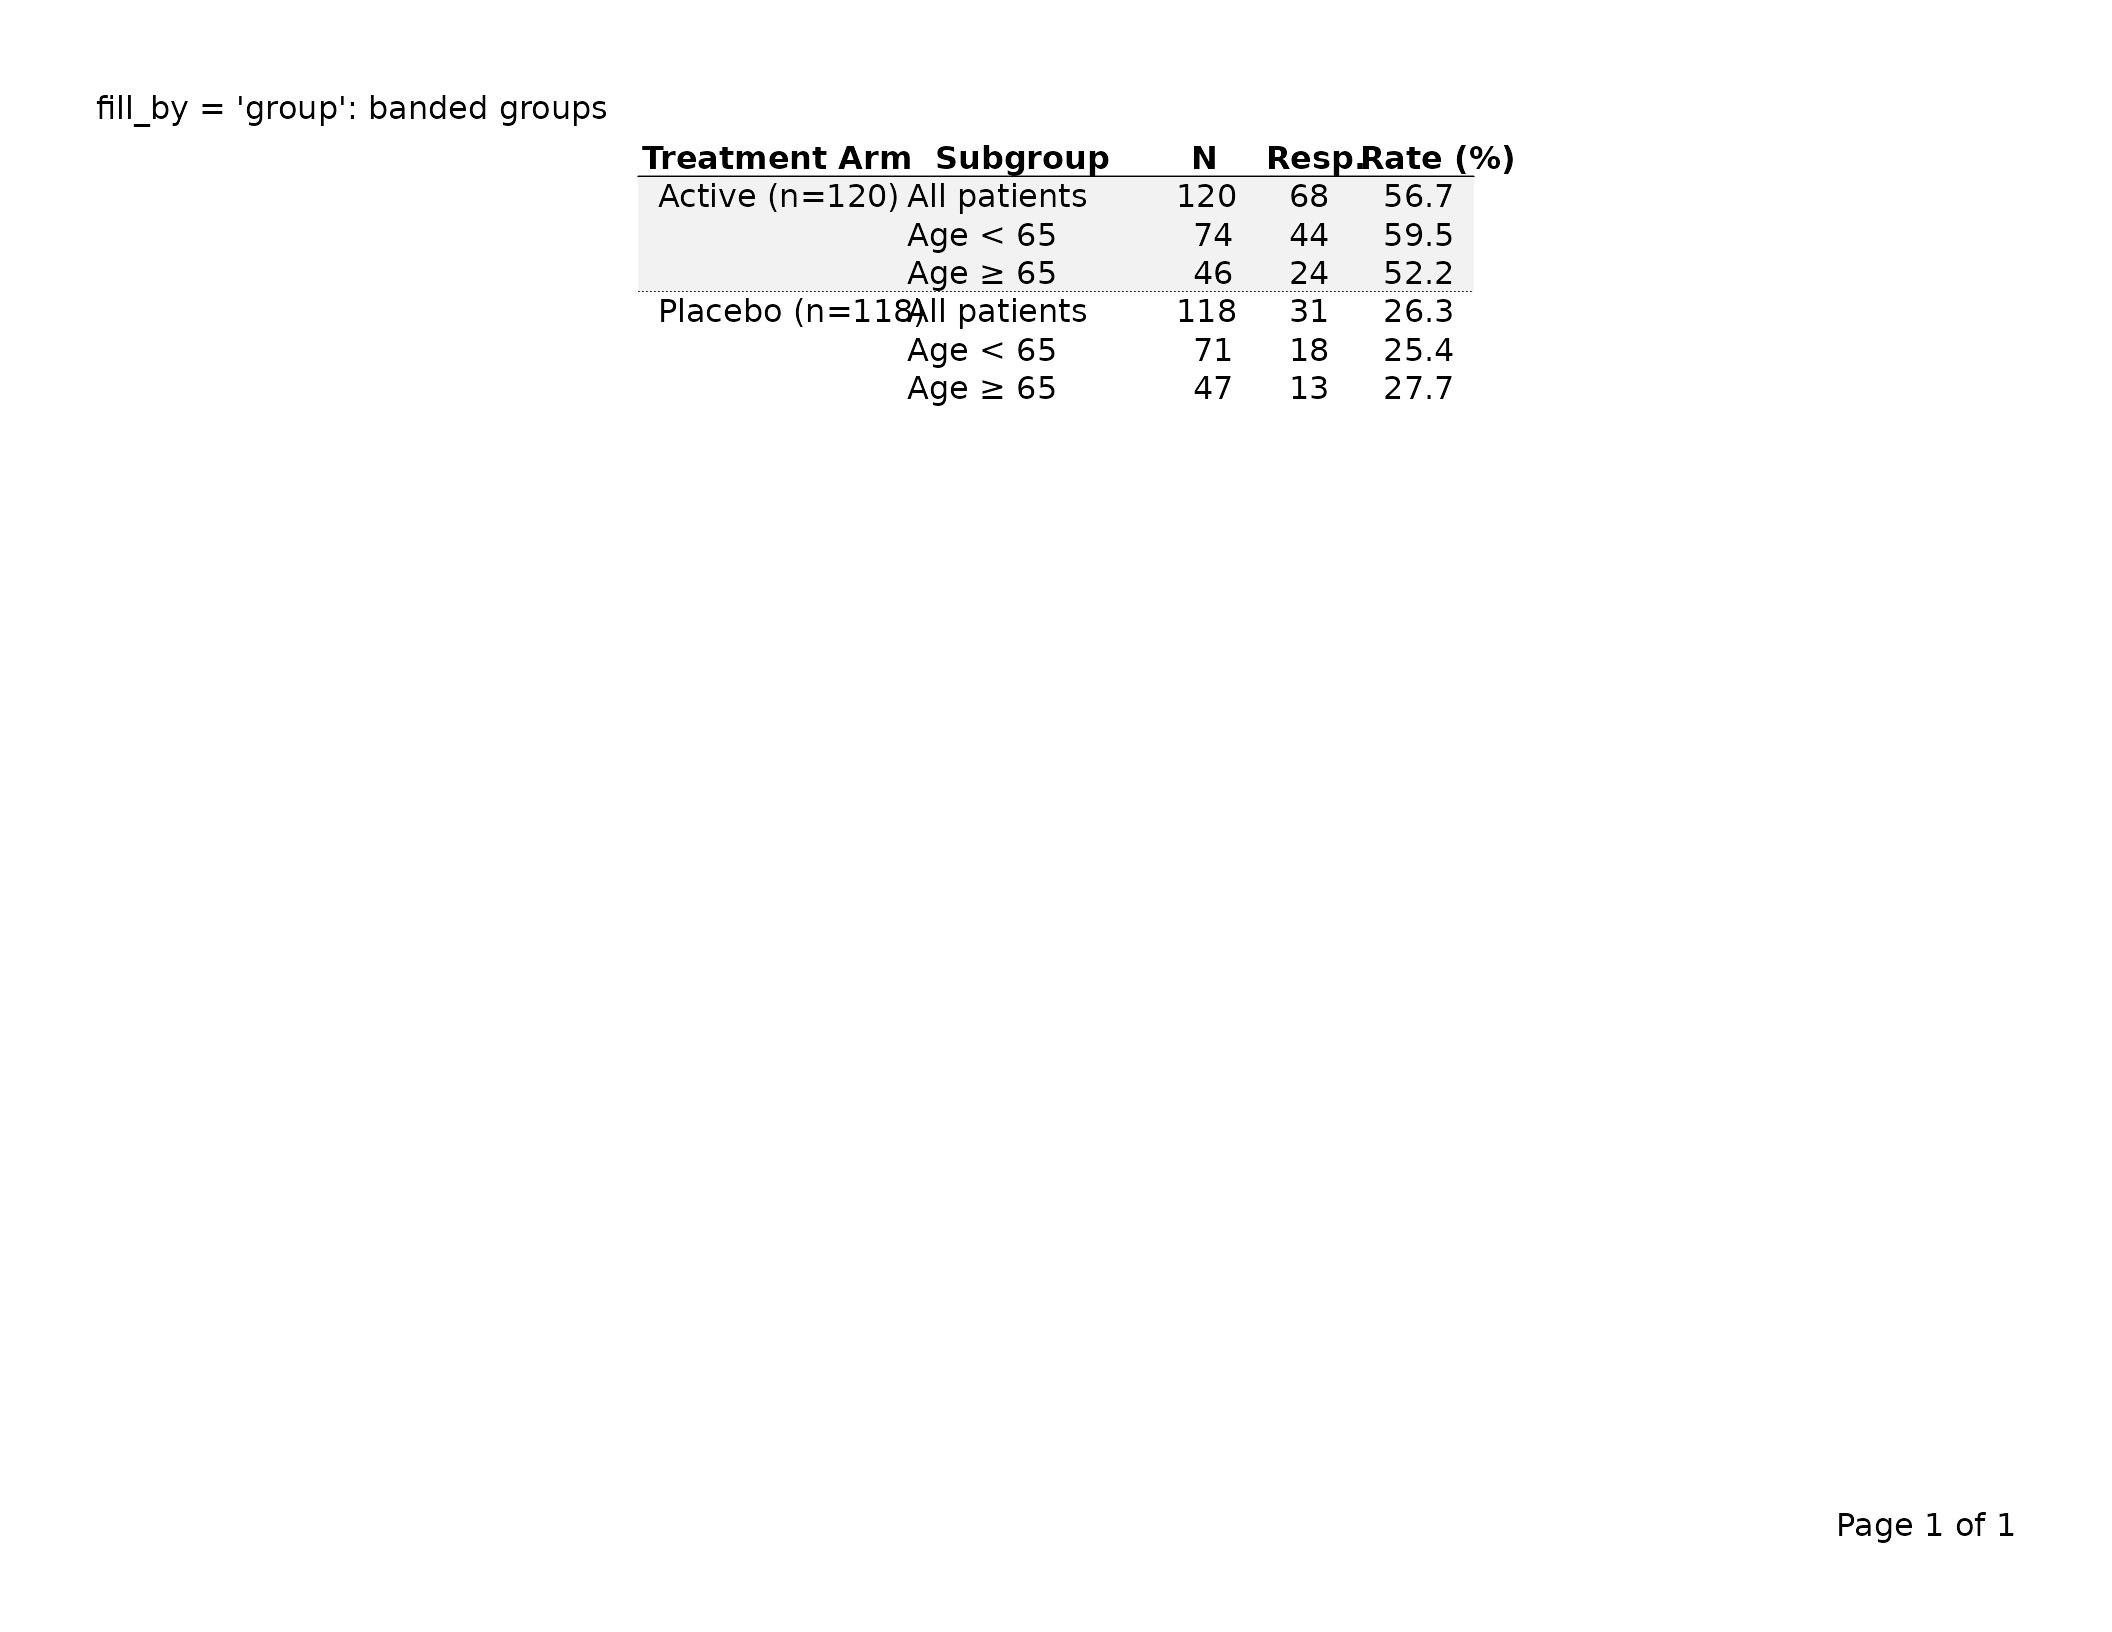
Word wrapping — wrap_cols,
wrap_breaks
wrap_cols and wrap_breaks control
text wrapping inside columns — the table reflows long
cell text and column-header labels onto multiple lines so a column can
be narrower. Distinct from page-column-split,
which handles a table that is too wide as a whole by spreading
its columns over more than one PDF page. The two run in order: text-wrap
first; then page-column-split as a fallback if the table still doesn’t
fit.
Default behaviour — wrap_cols = "auto"
Out of the box, every non-group column whose cells or header contain a break character (whitespace by default) is eligible for wrapping. Numeric columns and single-token strings are skipped because no amount of narrowing can make them break. The wrap pass only runs when the natural column widths exceed the available page width.
notes_df <- data.frame(
  visit = c("Baseline", "Week 4", "Week 12"),
  notes = c("Patient enrolled and signed informed consent",
            "Mild headache reported, resolved within 24 hours",
            "All scheduled assessments completed without issue")
)
tbl <- tfl_table(notes_df)   # wrap_cols = "auto" by default
Disabling wrap entirely
Pass wrap_cols = FALSE. The wrap module is bypassed; if
the table is wider than the page it will fall through to
page-column-split (or error when
allow_col_split = FALSE).
tbl <- tfl_table(notes_df, wrap_cols = FALSE)Per-column control
tfl_colspec(wrap = ...) overrides the table-level
setting:
-
wrap = TRUE— always eligible, even when no break character is present. -
wrap = FALSE— never eligible, even whenwrap_cols = "auto"would mark it. -
wrap = NA(default) — inherit fromwrap_cols.
tbl <- tfl_table(
  notes_df,
  cols = list(
    tfl_colspec("notes", width = unit(2, "inches"), wrap = TRUE)
  )
)
Custom break characters — wrap_breaks()
By default the wrap module breaks on whitespace (space, tab) and
consumes the whitespace at the break point. Pass a
wrap_breaks() object to configure additional break
characters:
-
drop— characters consumed at the break (whitespace; the default). -
keep_before— characters that stay on the left of the break, with the next character starting the new line. Useful for hyphenated terms or path-like strings.
# Break after "-" (hyphenated terms)
tbl <- tfl_table(
  hyphen_df,
  wrap_breaks = wrap_breaks(drop = " ", keep_before = "-")
)

# Break after "/" or "-" (path-like content)
tbl <- tfl_table(
  path_df,
  wrap_breaks = wrap_breaks(drop = " ", keep_before = c("-", "/"))
)
Leading spaces (indentation)
Leading spaces in cell text — a common way to indent sub-category labels in clinical tables — are preserved. The wrap module keeps a line’s leading spaces as a hanging indent: when the text wraps onto continuation lines, every wrapped line carries the same indent, and the indent width is counted when deciding where to break (so an indented line still fits its column).
df <- data.frame(
  Parameter = c("Adverse events",
                "  Any AE",
                "    Serious AE",
                "    Mild AE"),
  n = c(120L, 95L, 12L, 83L)
)
# The two- and four-space prefixes render exactly as written, and survive
# wrapping if the column is narrowed.
export_tfl(tfl_table(df), file = "ae.pdf")
This works in table cells, in column headers, and in page-level character content, captions, and footnotes. No option is needed — spaces are taken literally.
Tabs
The PDF graphics device cannot render the tab glyph (it draws nothing
and warns). writetfl therefore expands tabs to spaces
before measuring and drawing:
- A leading (indentation) tab — one preceded only by whitespace — becomes two spaces by default.
- An in-line tab — one with text to its left — becomes one space by default, which then behaves like an ordinary breakable space.
The two counts are advanced options. They are not part of
the main function signatures; pass them through ... to
export_tfl() (which forwards to
export_tfl_page()), where they apply to word-wrapped
character content, captions, and
footnotes:
# A tab-indented report note. Each leading tab -> 4 spaces, each in-line
# tab -> 1 space.
export_tfl(
  "\tStudy summary\n\t\tCohort A\twell tolerated",
  file              = "note.pdf",
  tab_indent_spaces = 4,   # advanced; via ...
  tab_infix_spaces  = 1    # advanced; via ...
)
Table cells and headers use the defaults (leading tab → 2 spaces, in-line tab → 1 space); for tabular data, indent with literal spaces when you need a specific depth.
Algorithm in one paragraph
The wrap module computes a floor per wrap-eligible column
equal to the larger of min_col_width and the rendered width
of that column’s longest unbreakable token. It then runs a
“water-from-top” pass: at each step it finds the widest set of
wrap-eligible columns above their floor and shrinks them together until
they meet the next-widest column or hit a floor — repeating until the
total fits or every wrap-eligible column has hit its floor.
Deterministic and bounded.
Optimising for height — wrap_balance = "height"
The default narrowing pass (wrap_balance = "width",
water-from-top) balances the widths of wrap-eligible columns.
That’s content-blind and fast, but on tables with very different content
density per column it can leave one column wrapping to many more lines
than its neighbour. When the goal is to fit more rows per page, opt in
to wrap_balance = "height":
tbl <- tfl_table(my_df, wrap_balance = "height")The height pass runs after water-fill, takes width away from columns whose cells have slack (short content) and gives it to columns whose cells are the bottleneck (long content). It accepts a move only if the resulting total table height is smaller, so the result is never worse than the default. The pass is time-budgeted at ~1 second; on any error or budget overrun the result silently falls back to water-fill widths.
Use the height pass when:
- You have multiple wrap-eligible string columns of obviously different content density.
- The default
wrap_balance = "width"is producing one column with many wrapped lines next to a column with one line of content. - You’d rather fit more rows on a page than have visually balanced column widths.
The default stays "width" because it’s deterministic,
fast, visually tidy, and produces good results on most clinical
TFLs.
Balanced split-then-wrap — col_split_strategy
When a table is too wide for a single page, two interacting
decisions have to be made: which columns go on which page
(page-column-split) and how aggressively each remaining column should
wrap. The default col_split_strategy = "balanced" does the
page-split first using each column’s minimum survivable
width, then water-fills each page’s columns within that page’s actual
horizontal slack. The legacy "wrap_first" strategy does
whole-table wrapping first and uses the resulting widths to drive the
split.
The practical difference shows up on multi-page tables:
| Strategy | Page-1 column behavior |
|---|---|
"balanced" (default) |
Each column gets the slack of the page it lands on. Strings on a
3-column page have ~3× more room than under
"wrap_first". |
"wrap_first" |
Every column is wrapped tightly enough to fit all columns on one page width, even though most end up on different pages anyway. |
# Default: balanced.  Per-page widths.
tbl <- tfl_table(wide_clinical_df)

# Legacy: whole-table wrap first.
tbl <- tfl_table(wide_clinical_df, col_split_strategy = "wrap_first")
Group columns are pinned at their minimum width on every page under
"balanced" (data columns absorb the per-page slack).
Together with the HTML-rowspan-style group-label flow this
keeps group cells compact without wasting page real estate.
When a row’s wrapped height genuinely exceeds the page, the balanced
strategy iterates: it raises the bottleneck column’s minimum by 0.25
inches and re-runs the width pipeline, up to
row_overflow_max_retries times (default 5L).
After the cap the existing overflow_action path fires. Set
row_overflow_max_retries = 0L to disable the loop
entirely.
Visual gap between adjacent multi-line cells —
wrap_extra_padding
When two consecutive rows both contain wrapped (multi-line) cells,
the bottom of one row’s wrapped text can sit visually flush against the
top of the next row’s wrapped text — making it hard to see where one row
ends and the next begins. wrap_extra_padding adds a
configurable amount of vertical space only at the bottom of
multi-line cells.
# Default: 0.5 lines of extra space below every multi-line cell.
tbl <- tfl_table(notes_df)

# Disable: pack rows tightly even when cells wrap.
tbl <- tfl_table(notes_df, wrap_extra_padding = unit(0, "lines"))

# More breathing room.
tbl <- tfl_table(notes_df, wrap_extra_padding = unit(0.5, "lines"))
The extra applies to any cell whose displayed text spans more than
one line — whether the lines come from the wrap algorithm or from
explicit \n in the data. Single-line cells are unaffected,
so the padding does not inflate compact tables.
Failsafe — row-overflow guard
A row whose wrapped height exceeds one page is almost always a sign
of input that needs to change (e.g. a 5,000-character cell forced into a
0.5-inch column). paginate_rows() raises an error in this
case via the same overflow_action switch as the
column-overflow guard:
# Raise error (default)
export_tfl(tbl, file = "out.pdf")

# Downgrade to a warning and still produce diagnostic output
export_tfl(tbl, file = "out.pdf", overflow_action = "warn")
Multi-page accessories
Column continuation message — col_cont_msg
When the table has more columns than fit on one page,
tfl_table() splits across multiple column-pages.
col_cont_msg is a character string displayed as rotated
side labels:
- Clockwise 90° (reading downward) to the right of the table on pages where columns continue on a subsequent page.
- Counter-clockwise 90° (reading upward) to the left of the full table (including row-label columns) on pages where columns continue from a prior page.
One line-height of spacing separates the table edge from the text.
Set col_cont_msg = NULL to suppress the labels
entirely.
# Default message
tbl <- tfl_table(
  clinical,
  col_cont_msg = "Columns continue on next page"
)

# Suppress
tbl_no_msg <- tfl_table(
  clinical,
  col_cont_msg = NULL
)
The corresponding row_cont_msg for row-pagination
markers is covered under Continuation
marker — gp$continued and row_cont_msg in
the typography section above.
Sub-tables — sub_tfl
sub_tfl splits a single tfl_table into one
self-identifying sub-table per unique combination of values in the named
columns. The columns named in sub_tfl are removed
from the rendered table body and instead appear in the caption
as "label: value; label: value".
This is the idiomatic way to produce by-group tables (e.g. one table per treatment arm, per visit) without manually splitting the data and stitching the page lists together.
tbl_by_arm <- tfl_table(
  clinical,
  sub_tfl = "treatment",
  cols    = col_spec
)

export_tfl(
  tbl_by_arm,
  caption = "Table 1. Response by Subgroup",
  preview = 1L
)
The first preview page shows
Table 1. Response by Subgroup followed on a new line by
Treatment Arm: Active (n=120) (the colspec label is reused,
not the raw column name). The treatment column itself is no
longer in the table body. A second page contains the placebo arm.
Multiple sub_tfl columns
Naming more than one column produces the Cartesian product, with the first column varying outermost:
Formatting controls
Three formatting arguments mirror paste():
| Argument | Default | Role |
|---|---|---|
sub_tfl_sep |
": " |
between each column’s label and value |
sub_tfl_collapse |
"; " |
between successive label: value pairs |
sub_tfl_prefix |
"\n" |
between the existing caption and the suffix |
tfl_table(
  clinical,
  sub_tfl          = c("treatment", "subgroup"),
  sub_tfl_sep      = " = ",
  sub_tfl_collapse = " | ",
  sub_tfl_prefix   = " — "
)
# Caption per page: "Table 1 — Treatment Arm = Active (n=120) | Subgroup = ..."
When the global caption is NULL, the suffix
becomes the entire caption (no leading prefix).
Ordering
Sub-tables are produced in this order:
-
Factor columns drive their own ordering by
levels()(only levels that appear in the data are emitted). Use a factor when you need a clinically meaningful order such asActivebeforePlacebo. - Character / numeric columns use first-appearance order in the data.
Overlap with group_vars()
When a column listed in sub_tfl is also a
dplyr::group_by() variable (a row-header column), it is
promoted to the caption — i.e. removed from both the rendered body and
from group_vars. This is a common case:
Complete examples
The following pair of examples contrasts the out-of-the-box clinical
appearance with a more compact publication-style variant. Both render
using preview = TRUE.
Default clinical look
tbl_clinical <- clinical |>
  group_by(treatment) |>
  tfl_table(
    cols                  = col_spec,
    col_header_rule       = TRUE,
    group_rule            = TRUE,
    group_rule_after_last = FALSE,
    row_header_sep        = TRUE,
    cell_padding          = unit(0.2, "lines")
    # gp uses built-in defaults: bold headers, dotted group rules, etc.
  )

export_tfl(
  tbl_clinical,
  preview        = TRUE,
  pg_width       = 11,
  pg_height      = 8.5,
  header_left    = "Study XYZ-001",
  header_right   = "CONFIDENTIAL",
  caption        = "Table 1. Response rates by treatment arm and age subgroup.",
  footnote       = "Abbreviations: Resp. = responders; Rate = response rate.",
  footer_left    = "Program: t_resp.R",
  margins        = unit(c(t = 0.75, r = 0.75, b = 0.75, l = 0.75), "inches")
)
Publication style
tbl_publication <- clinical |>
  group_by(treatment) |>
  tfl_table(
    cols                  = col_spec,
    col_header_rule       = TRUE,
    group_rule            = FALSE,   # no between-group rules
    group_rule_after_last = FALSE,
    row_header_sep        = FALSE,   # no vertical separator
    cell_padding          = unit(c(0.25, 0.08), "lines"),
    gp = list(
      # smaller, serif base font
      table           = gpar(fontsize = 8, fontfamily = "serif"),
      # plain (not bold) column headers, slightly larger
      header_row      = gpar(fontface = "plain", fontsize = 9, fontfamily = "serif"),
      # italicized group column
      group_col       = gpar(fontface = "italic"),
      # heavier header rule
      col_header_rule = gpar(lwd = 1.5),
      # smaller, lighter continuation marker
      continued       = gpar(fontface = "italic", fontsize = 7, col = "grey60")
    )
  )

export_tfl(
  tbl_publication,
  preview        = TRUE,
  pg_width       = 8.5,
  pg_height      = 11,
  caption        = "Table 1. Response rates by treatment arm and age subgroup.",
  footnote       = "Resp. = responders; Rate (%) = response rate.",
  margins        = unit(c(t = 1, r = 1, b = 1, l = 1), "inches")
)
The two outputs differ visibly in:
- Font family and weight (sans-serif bold headers vs. serif plain headers)
- Presence of group rules and the vertical row-header separator
- Cell padding (uniform vs. asymmetric v/h form)
- Header rule weight
- Continuation marker appearance
Spanning (multi-row) column headers
Clinical and regulatory tables frequently need a
super-header that spans several columns — for example
one label per treatment arm sitting above that arm’s n and
Mean columns. tfl_table() builds these
directly from the column labels: split a label on
col_header_sep (default "|||") and each piece
becomes one stacked header row. Adjacent columns whose text is equal in
a row merge into a single spanning cell, sized to the sum of the
columns beneath it.
resp <- data.frame(
  subgroup = c("All patients", "Age < 65", "Age ≥ 65"),
  pbo_n    = c(118L, 71L, 47L),
  pbo_mean = c(26.3, 25.4, 27.7),
  act_n    = c(120L, 74L, 46L),
  act_mean = c(56.7, 59.5, 52.2)
)

tbl_span <- tfl_table(
  resp,
  col_labels = c(
    subgroup = "Subgroup",
    pbo_n    = "Placebo|||n",       pbo_mean = "Placebo|||Mean (%)",
    act_n    = "Active|||n",        act_mean = "Active|||Mean (%)"
  )
)

export_tfl(tbl_span, preview = TRUE,
           caption = "Table 2. Response rate by treatment arm.")
Placebo spans its two columns, Active spans
its two, and Subgroup (a one-piece label) simply sits in
the bottom row. Each spanning group is underlined; adjacent groups’
underlines are separated by a gap equal to the cell’s horizontal padding
so they read as distinct group rules. Turn the underlines off with
col_header_span_rule = FALSE, or restyle them via
gp$col_header_span_rule (they default to the
gp$col_header_rule style).
Bottom-alignment of uneven-depth labels
Labels need not have the same number of pieces. A shorter label fills the bottom rows, leaving the rows above it blank, so single-row labels line up with the deepest labels’ leaf row:
tbl_uneven <- tfl_table(
  resp,
  col_labels = c(
    subgroup = "Subgroup",                       # 1 row  -> bottom
    pbo_n    = "Placebo|||n", pbo_mean = "Placebo|||Mean",
    act_n    = "Active|||n",  act_mean = "Active|||Mean"
  )
)
export_tfl(tbl_uneven, preview = TRUE)
To leave a deliberately blank middle row for one
column, use two separators in a row (e.g. "Top||||||Bottom"
with the default "|||").
Hierarchical merging (only within a shared parent)
Merging is hierarchical: two adjacent cells merge only when they also
share the span directly above them. This is what keeps two identically
named leaf columns apart when they belong to different super-headers —
"Placebo|||n" and "Active|||n" never fuse
their two n cells, because Placebo ≠
Active one row up.
Preventing an unwanted merge (trailing-space escape hatch)
Merging compares the raw label text but draws it right-trimmed. So if two columns would merge but you want them kept separate, append a space to one of them: it changes the comparison without changing what is printed.
# Two "Total" columns kept distinct by a trailing space on the second.
totals <- data.frame(x = 1:2, t1 = 3:4, t2 = 5:6)
tbl_escape <- tfl_table(
  totals,
  col_labels = c(x = "Item", t1 = "Summary|||Total", t2 = "Summary|||Total ")
)
export_tfl(tbl_escape, preview = TRUE)
Both Total cells render identically but stay in their
own columns; Summary still spans both.
Disabling the feature or changing the separator
Set col_header_sep = NA to turn spanning headers off
entirely (labels are then taken verbatim, including any literal
"|||"). If a real label legitimately contains
"|||", pick a different token,
e.g. col_header_sep = "@@".
Gotchas
- A spanned block is kept together across
column-continuation pages (it is never split). If a single spanned block
is wider than the page, that is reported through
overflow_action(error by default) — widen the page or narrow the columns. -
"\n"still forces a line break within a single header cell and is independent ofcol_header_sep; you can combine them (e.g."Treatment|||Mean\n(SD)").