Make a tibble where one column is the data to plot, one is the gglist, and one is the caption
Source:R/ggtibble.R
ggtibble.RdMake a tibble where one column is the data to plot, one is the gglist, and one is the caption
Usage
ggtibble(data, ...)

# S3 method for class 'data.frame'
ggtibble(
  data,
  mapping = ggplot2::aes(),
  ...,
  outercols = group_vars(data),
  labs = list(),
  caption = "",
  footnote = "",
  label = ""
)
Arguments
- data
The data.frame to plot
- ...
Passed to subsequent methods (usually passed to
gglist())- mapping
Default list of aesthetic mappings to use for plot. If not specified, must be supplied in each layer added to the plot.
- outercols
The columns to have outside the nesting
- labs
Labels to add via
labs_glue()- caption
The glue specification for creating the caption
- footnote
The glue specification for creating the footnote, a note rendered under each figure and kept with it (see "Footnotes and labels" in
knit_print.gglist()). The default""gives no footnote.- label
The glue specification for creating each figure's label, its identifier for cross-references and part of the name of its image file. Labels must be unique, ignoring case, and may contain only letters, digits, hyphens, underscores, and dots. Under Quarto, start them with
fig-so that@fig-...cross-references resolve. The default""gives no label.
Value
A data.frame with a column named "data_plot" with the data to plot, "figure" with the gglist, "caption" with the captions, "footnote" with the footnotes, and "label" with the figure labels
A ggtibble object which is a tibble with columns named "figure"
which is a gglist object (a list of ggplots), "data_plot" which is the a
list of data.frames making up the source data used for each individual
plot, "caption" which is the text to use for the plot caption, "footnote"
which is the text to show under the plot, "label" which is the plot's
identifier, and all of the outercols used for nesting.
Examples
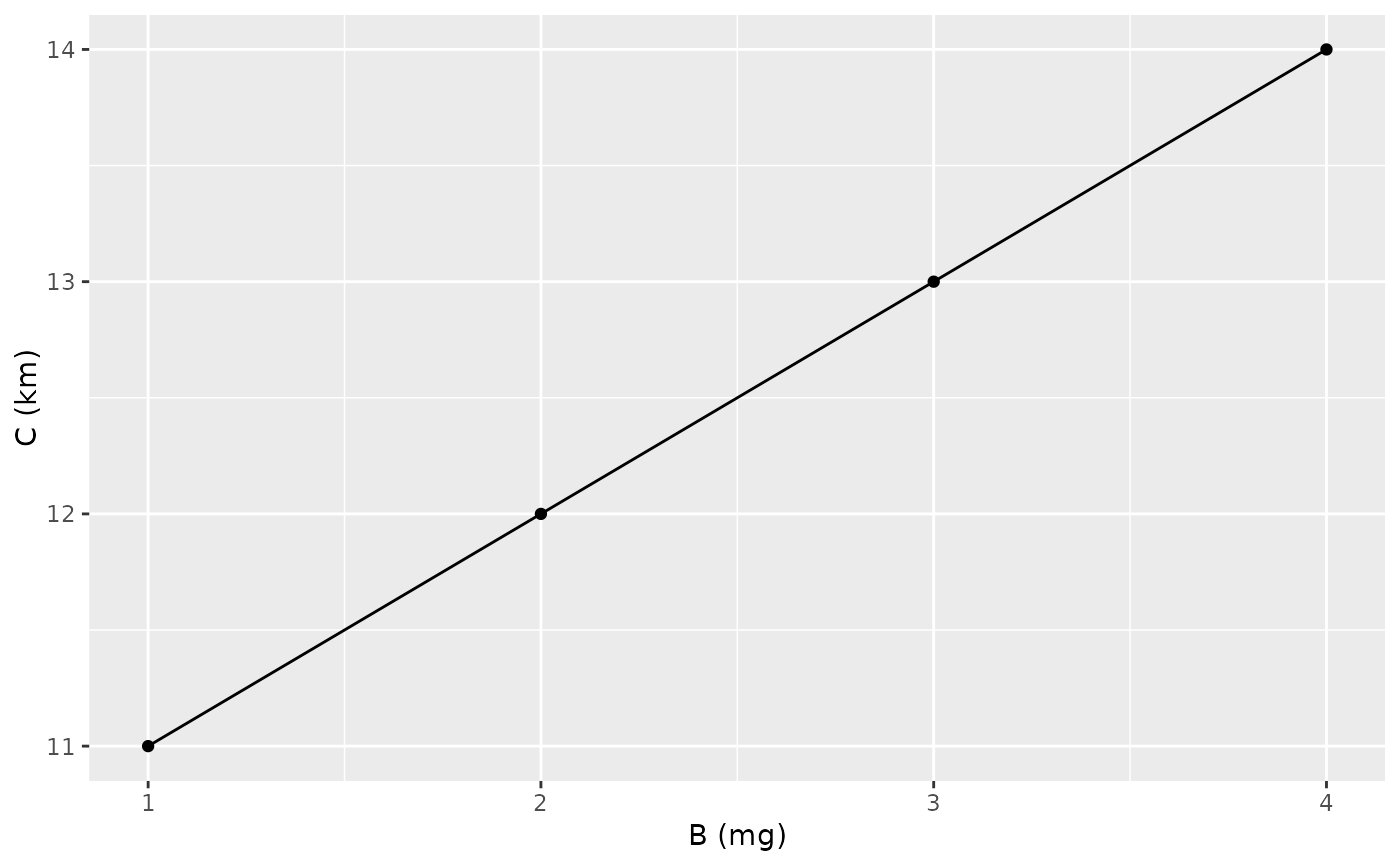
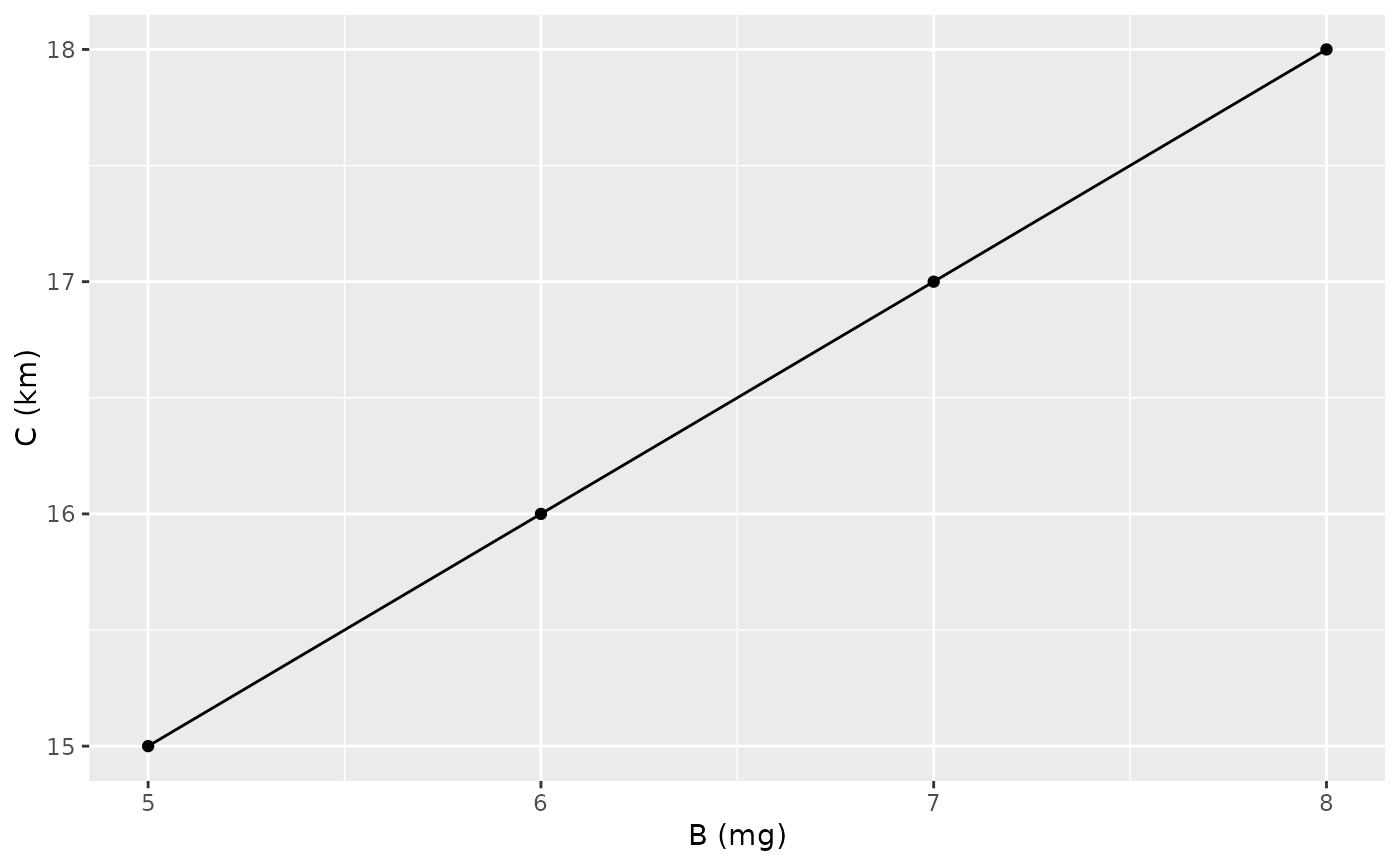
d_plot <-
data.frame(
A = rep(c("foo", "bar"), each = 4),
B = 1:8,
C = 11:18,
Bunit = "mg",
Cunit = "km"
)
all_plots <-
ggtibble(
d_plot,
ggplot2::aes(x = B, y = C),
outercols = c("A", "Bunit", "Cunit"),
caption = "All the {A}",
labs = list(x = "B ({Bunit})", y = "C ({Cunit})")
) +
ggplot2::geom_point() +
ggplot2::geom_line()
knit_print(all_plots)
#>
#>
 #>
#>
#>
#>
#>
#>
 #>
#>
#>
#>